Ripple Price Prediction: XRP/USD Ready to Break Above $1.25
Ripple Price Prediction – September 1
The Ripple price prediction is slightly bullish as the market continues to respect the $1.15 support and could push the coin upward.
XRP/USD Market
Key Levels:
Resistance levels: $1.40, $1.45, $1.50
Support levels: $1.00, $0.95, $0.90
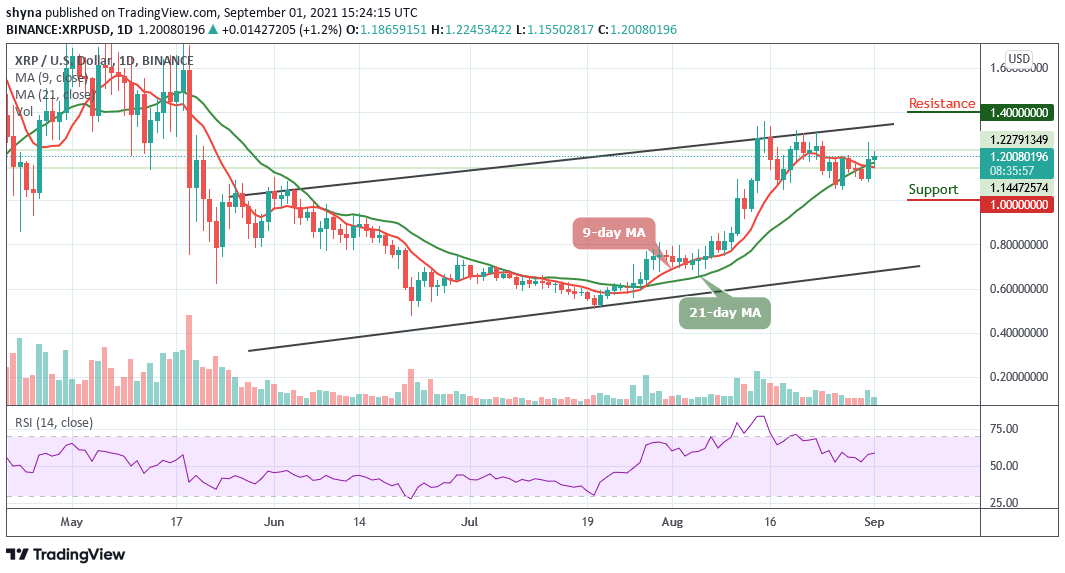 XRPUSD – Daily Chart
XRP/USD has been trading sideways since a few weeks ago, gaining around 1.2% during the negotiation today. Looking at the daily chart, the Ripple (XRP) has been rising after touching the daily low at $1.15. At the time of writing, bulls are making an attempt to come back into the market with a cross above the 9-day and 21-day moving averages, which may head towards the resistance level of $1.25.
Ripple Price Prediction: Ripple Price May Struggle Above $1.25?
The Ripple price remains the sixth-largest cryptocurrency with a market cap of $56.04 billion. The Ripple price has seen a tremendous increase in the market yesterday and it is currently trading around $1.20. In the meantime, XRP/USD may continue to follow a sideways movement before deciding on the next direction of the market.
Moreover, should in case the price breaks above the upper boundary of the channel, the resistance levels of $1.40, $1.45, and $1.50 could be visited. Meanwhile, for a break below the moving averages, the Ripple price may hit the supports at $1.00 and $0.95 and if the price falls below the previous levels, another support could be located at $0.90 while the Relative Strength Index (14) stays above 50-level.
When compares with Bitcoin, the Ripple price is currently changing hands at 2498 SAT and it’s hovering above the 9-day and 21-day moving averages. Therefore, if the 21-day MA serves as the market support, the Ripple price may likely face the key resistance at 2700 SAT. By reaching this level, XRP/BTC could hit the resistance level of 2800 SAT and above.
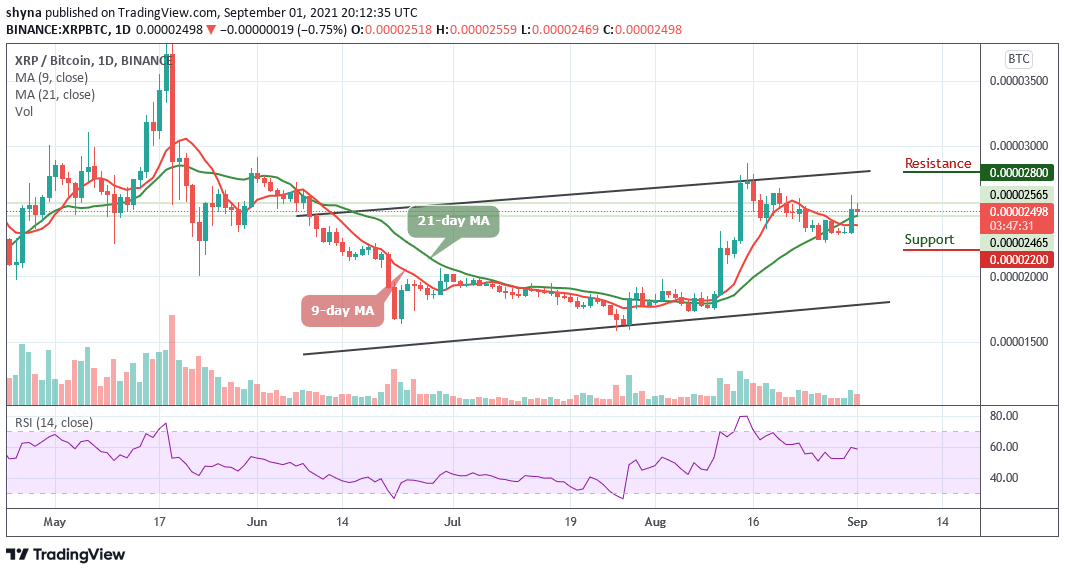 XRPBTC – Daily Chart
However, if the bulls fail to keep the price above the 9-day and 21-day MAs, the market may continue its downtrend and the pair could probably record further declines towards the lower boundary of the channel. However, a further bearish move could bring the coin to the support level of 2200 SAT and below while the signal line of the Relative Strength Index (14) moves below 60-level.
Looking to buy or trade Ripple (XRP) now? Invest at eToro!
75% of retail investor accounts lose money when trading CFDs with this provider
Comments are closed.