Litecoin Price Prediction: LTC/USD Market Experiences an Upsurge
Litecoin Market Experiences an Upsurge – September 5
An upsurge features in the LTC/USD market operations after a notable differential long-range of price movements in $150 and $200. There is a positive percentage rate of about 1.08 on the crypto’s financial book of records, showing the actual trading level at about $214 as of writing.
Market Experiences an Upsurge: LTC Trade
Key Levels:
Resistance levels: $240, $280, $320
Support levels: $180, $160, $140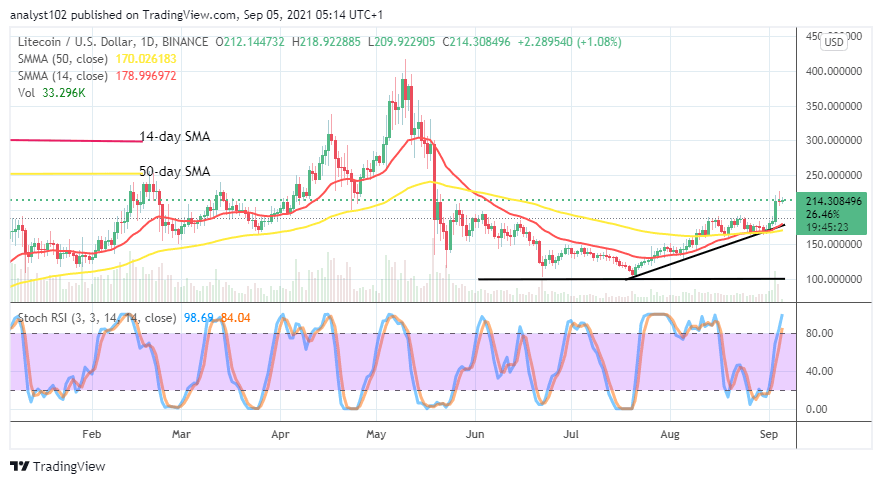
LTC/USD – Daily Chart
The LTC/USD daily chart showcases that the LTC/USD market experiences an upsurge, breaching northward above the previous resistance trading point of $200. A bullish candlestick occurred during the September 3 rd trading session to mark the start of the breaking out. The 14-day SMA indicator has slightly intercepted the 50-day SMA indicator to the north side. The bullish trend-line drew, playing a supportive role to the smaller SMA. The Stochastic Oscillators have freshly moved into the overbought region, still pointing to the upward direction.
Could there be a continued stable upward movement in the crypto economy as the market experiences an upsurge?
There may be a long featuring of trading in $200 and $240 or an extension of around $250 capable of featuring by lower highs and lower lows. It expected of the September 3rd bullish formation of a candlestick that a buying wall may play out alongside it afterward. In other words, there may be slight southward moves along the path of the bullish candlestick purposefully to allow bulls to find support. Therefore, it will technically sound ideal to look out for a decent buy entry.
On the downside, the LTC/USD market bears have to be wary of exerting their positions at this time. The positioning of the Stochastic Oscillators in the overbought region portends an unsafe moment to getting decent sell orders. A line of price convergences is needed to allow to occur to give way to the seamless direction around a higher spot to the present trading zone.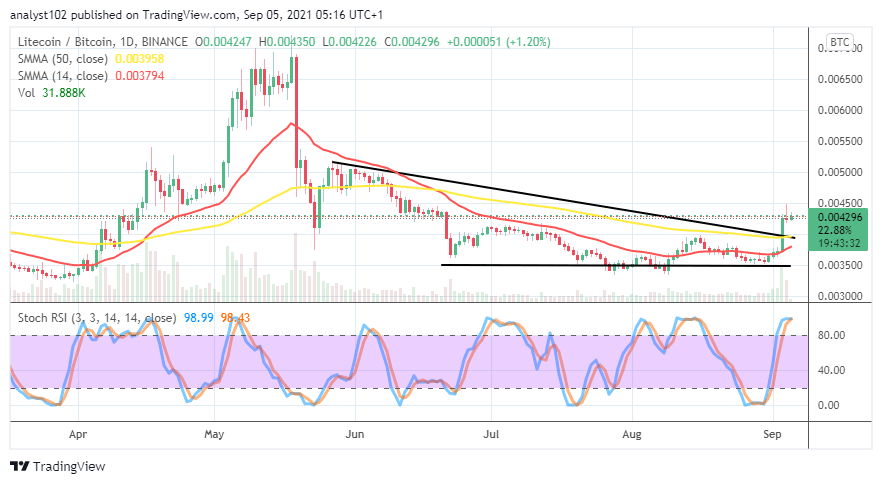
LTC/BTC Price Analysis
In comparison, the LTC/BTC price analysis chart depicts that the cryptocurrency pair market experiences an upsurge. That indicates that the base crypto trends at a higher pace against the counter crypto. The 14-day SMA trend-line closely points northward beneath the 50-day SMA trend-line. The bearish trend-line drew above the bigger SMA, conjoining it at the tail end. The Stochastic Oscillators are in the overbought region with the lines closed. That could mean an indication that the market may begin to experience a pit stop.
Looking to buy or trade Litecoin (LTC) now? Invest at eToro!
75% of retail investor accounts lose money when trading CFDs with this provider.
Read more:
Comments are closed.