Bitcoin (BTC/USD) Business Activity Pushes Past $50,000
Bitcoin Price Prediction – September 4
The BTC/USD business activity pushes past the line of $50,000 after a long featuring of price reversing movements below it in the recent past operations. As of writing, the crypto records a relative percentage increase rate of around 0.02, trading at about $50402. The present trading situation appears, responding more slightly positively to the upsides than the downsides.
BTC/USD Market
Key Levels:
Resistance levels: $52,500, $55,000, $57,500
Support levels: $45,000, $42,500, $40,000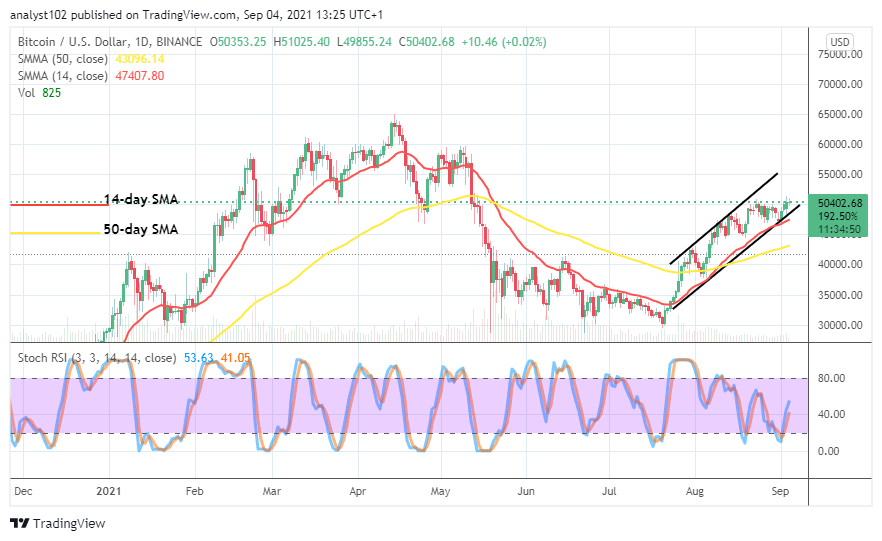
BTC/USD – Daily Chart
The BTC/USD daily chart showcases that the crypto’s business activity pushes past the $50,000 trading level that some failing attempts made to push past recently. The slight uprise began on the last day of last month while a bullish candlestick emerged, leading to springing the trade further to the north. The lower bullish channel trend-line remains drawn alongside the smaller SMA indicator. The 50-day SMA trend-line is underneath the 14-day SMA trend-line. The Stochastic Oscillators have crossed northbound from around the range of 10 past a bit above range 40, still pointing to the upside direction.
Will the crypto market keep an upward trend as the BTC/USD business activity pushes past $50,000?
More often than none, there has been a line of price reverses around $50,000 in the recent past operations. But, the BTC/USD business activity pushes now past it. It established that the point earlier mentioned now becomes a support line that bulls expectantly have to push price northward further to stay afloat in the market. However, the 14-day SMA positions itself around $47,500 as its suggested support line to the current higher trading line of the market.
On the downside, it may be a bit difficult to observe a decent sell-off trading time of the market presently. Therefore, the BTC/USD market bears are to patiently await a major price rejection motion around a high trading line to be able to spot the probable time to consider a sell order. An aggressive price movement coupled with a quick reversal psyche is most required to give a nod to a sell position afterward.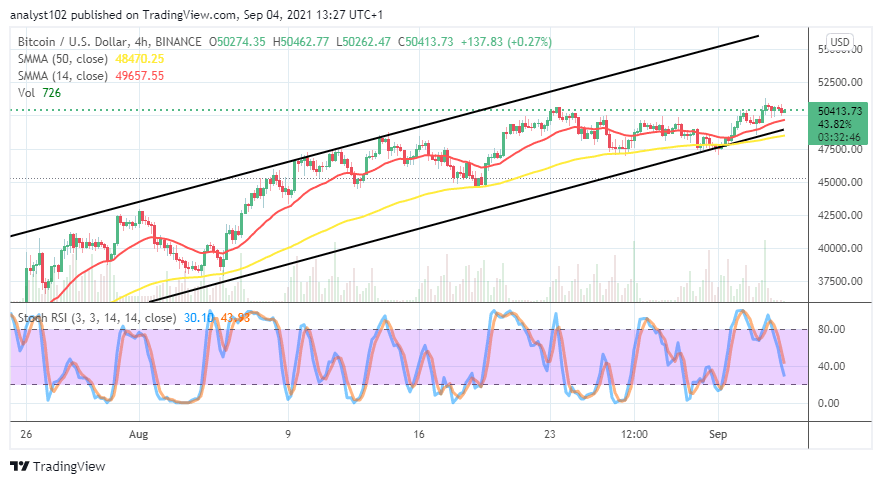
BTC/USD 4-hour Chart
It is firmly depicted on the BTC/USD 4-hour chart that the crypto’s business activity pushes past the line of $50,000. All the SMA trend lines are closely around the lower bullish channel trend-line. The 14-day SMA indicator is near above the 50-day SMA indicator. About variant six smaller candlesticks feature a bit above the value mentioned earlier. The Stochastic Oscillators have protruded the line southbound near over the range of 20. It seems that the price is a bit slowing downward. There may be a line of low-active price movements soon.
Looking to buy or trade Bitcoin (BTC) now? Invest at eToro!
75% of retail investor accounts lose money when trading CFDs with this provide
Read more:
Comments are closed.