Bitcoin Price Prediction: BTC/USD Suffers Another 0.90% Drop
Bitcoin Price Prediction – September 17
The Bitcoin price prediction shows BTC dropping from $48,176 to $46,752 in minutes but managed to recover.
BTC/USD Long-term Trend: Bullish (Daily Chart)
Key levels:
Resistance Levels: $52,000, $54,000, $56,000
Support Levels: $43,000, $41,000, $39,000
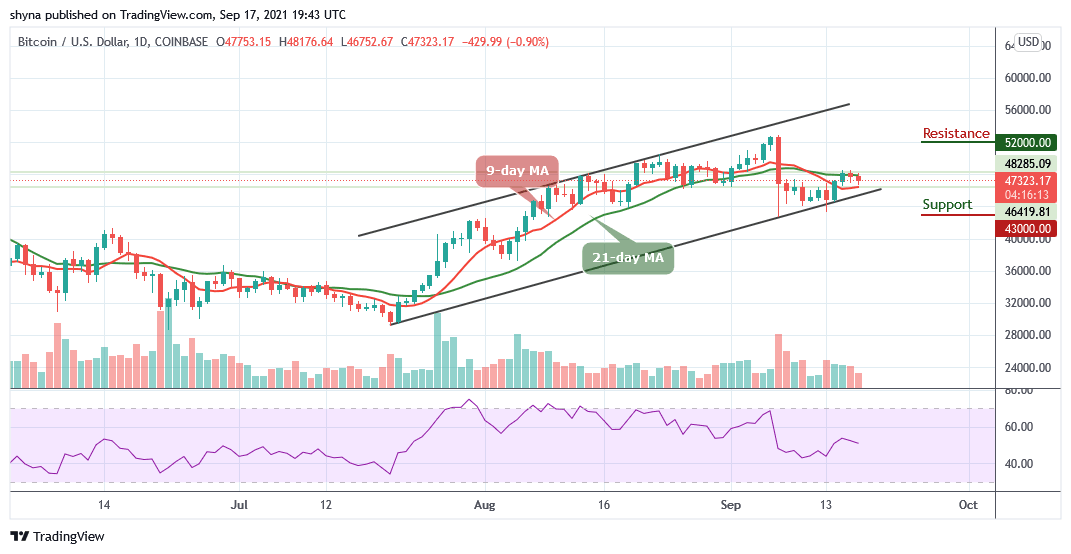 BTCUSD – Daily Chart
At the time of writing, BTC/USD is trading down marginally at its current price of $47,323. This is around the price at which it has been trading throughout the past few days. BTC/USD falling below $47,500 and undergoing rejections at $48,000 is not positive for the bull case. Although the bulls have tried and failed on multiple separate occasions to gather enough buying pressure to break $48,000, each attempt still failed simultaneously.
Bitcoin Price Prediction: Bitcoin (BTC) May Hold Critical Support
The Bitcoin price is currently trading below the 21-day moving average at $47,323 after an attempt by the bears to take the price down to $46,500. The move happened in less than one hour after Bitcoin dropped below 21-day MA at $46,752 which is an important support level on the daily chart but the bulls managed to bounce back up from this level to $47,323 where it is currently.
It is important to note that Bitcoin’s inability to post any sustained closes within the $48,000 region shows that it is currently plagued by underlying weakness. However, the potential resistance levels for the coin are located at $52,000, $54,000, and $56,000 while the critical supports lie at $43,000, $41,000, and $39,000 as the technical indicator Relative Strength Index (14) is preparing to move below 50-level, suggesting more bearish signals.

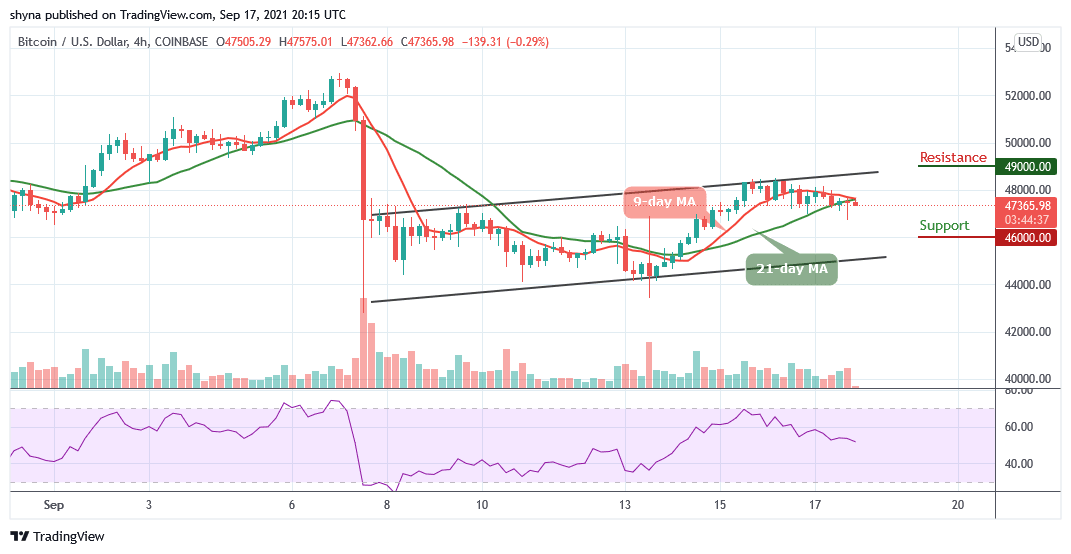
BTC/USD Medium-Term Trend: Ranging (4H Chart)
On the 4-Hour chart, the Bitcoin price is seen trading below the 9-day and 21-day moving averages as the red-line of the 9-day MA is about to cross below the green-line of the 21-day MA to confirm the bearish movement. Therefore, the immediate support is below the moving averages at the $46,752 level.
 BTCUSD – 4 Hour Chart
However, the Bitcoin price may likely fall below $47,000 if the bears fully stepped back into the market and a further bearish movement could hit the critical support at $46,000 level and below while the resistance level could be found above the moving averages at $49,000 and above. Meanwhile, BTC/USD is currently moving in sideways as the technical indicator Relative Strength Index (14) moves around 52-level.
Looking to buy or trade Bitcoin (BTC) now? Invest at eToro!
67% of retail investor accounts lose money when trading CFDs with this provider
Read more:
Comments are closed.