Ripple Price Prediction: XRP/USD Breaks Beneath $1.05 Once Again
Ripple Price Prediction – September 17
The Ripple price prediction continues to fall with a loss of 2.15% as the coin drops back beneath $1.05 to reach $1.03.
XRP/USD Market
Key Levels:
Resistance levels: $1.25, $1.30, $1.35
Support levels: $0.90, $0.85, $0.80
 XRPUSD – Daily Chart
XRP/USD managed to push above $1.10 as the coin penetrated a short-term falling price channel. The cryptocurrency touched the $1.10 level before it started to head lower. Yesterday, XRP/USD fell from $1.13 as it dropped back into the previous short-term declining channel. This decline continued today as the coin penetrated back beneath $1.05 and reached the support at $1.03 below the lower boundary of the channel.
Ripple Price Prediction: Ripple (XRP) Ready For More Drops
The Ripple price is currently rebounding slightly to trade at $1.06. The coin has been bouncing back into the channel after touching the daily low of $1.03, and a clean daily candle close above $1.10 could allow the bull-run to continue. A couple of days ago, XRP/USD peaked above the first high and touched $1.13 but got rejected slightly dropping below $1.13 in the next two days.
Nevertheless, if the sellers push the coin lower, the first level of support is located at $1.0. If the bears continue beneath $0.95, further supports are located below the lower boundary of the channel at $0.90, $0.85, and $0.80. On the other side, if the bulls can regroup and push higher, the first level of resistance lies at $1.20. Following this, additional resistance is located at $1.25, $1.30, and $1.35 levels. Meanwhile, the RSI (14) is moving below 50-level, suggesting that the sellers are coming into play.

Against Bitcoin, the pair is currently trading below the 9-day and 21-day moving averages, if the sellers push the price beneath the lower boundary of the channel, the first level of support is located at 2100 SAT. Beneath this, other support lies could be found at 2000 SAT and below.
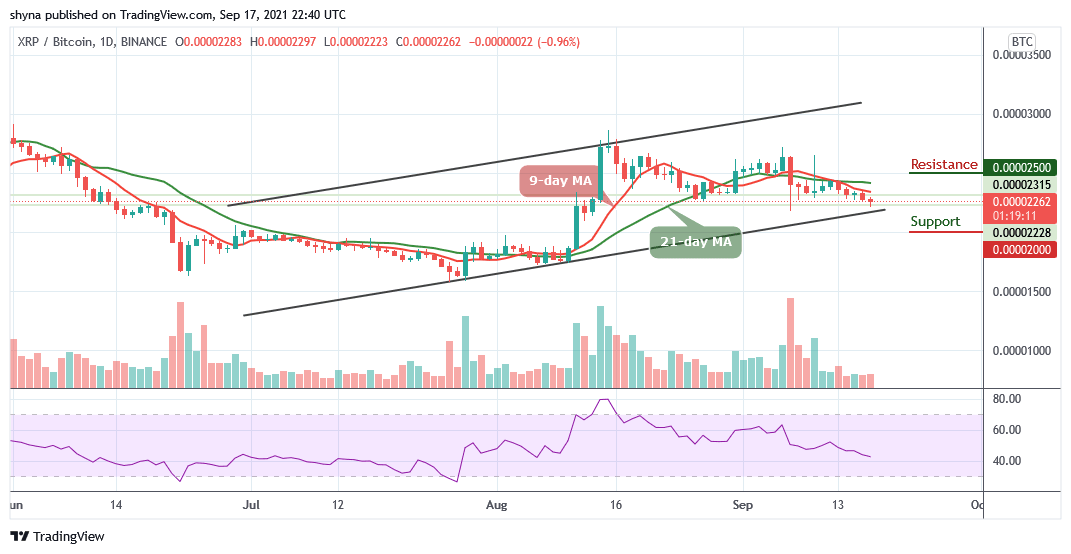 XRPBTC – Daily Chart
On the other side, should the price cross above the moving averages, the first level of resistance lies at 2450 SAT. Following this, potential resistance may be reached at 2500 SAT and above. In other words, the Relative Strength Index (14) moves to cross below 40-level, suggesting more bearish signals into the market.
Looking to buy or trade Ripple (XRP) now? Invest at eToro!
67% of retail investor accounts lose money when trading CFDs with this provider
Read more:
Comments are closed.