XRP Price Prediction: XRP/USD Trade Features Around $1.20 and $1.00 Levels
XRP Trade Features Around $1.20 and $1.00 Levels– September 15
It is closely observed, that the XRP/USD trade features around $1.20 and $1.00 levels over a couple of trading days’ sessions. As of writing, the crypto’s price worth trades around $1.08 at a smaller negative percentage rate of about 0.82. That gives a sign that the base trading instrument seems still under pressure.
Trade Features Around $1.20 and $1.00 Levels: XRP Market
Key Levels:
Resistance levels: $1.20, $1.40, $1.60
Support levels: $1.00, $0.90, $0.80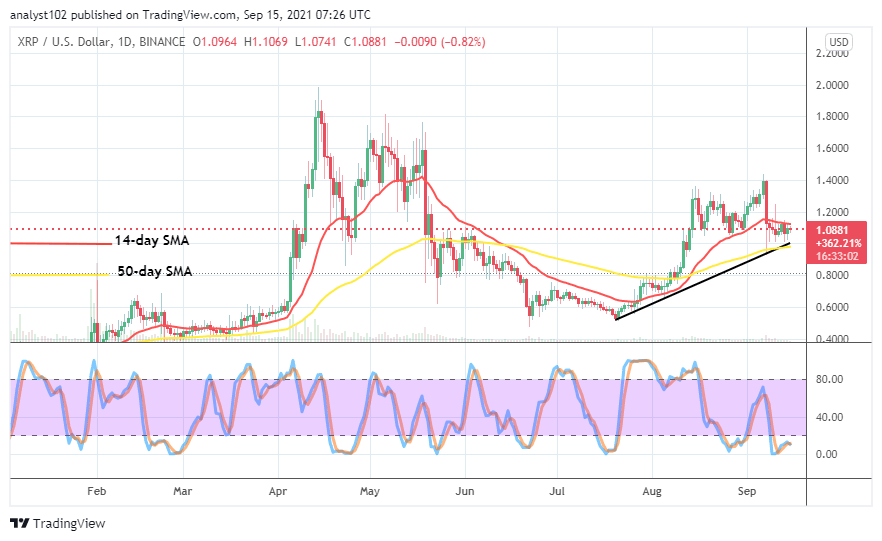
XRP/USD – Daily Chart
The XRP/USD daily chart reveals that the crypto trade features around $1.20 and $1.00. On September 10th trading time, a candlestick formed against the higher value line to the upside but, it shortly decimated back into the two trading lines mentioned earlier. The 14-day SMA trend line is in the value lines above the 50-day SMA trend line is at the lesser point. The bullish trend drew to play a supportive outfit to the bigger SMA. The Stochastic Oscillators are in the oversold region. And, they tend to bend southbound beneath the range of 20. That suggests that a degree of downs is ongoing.
What could be the next price direction now that the crypto trade features around $1.20 and $1.00 levels?
In the first place, it appears that the levels of $1.20 and $1.00 needed to be regarded as range-bound value lines as the crypto-economic trade features around them presently. It would be highly technical expected of the Ripple XRP/USD market bulls to exercise some patience by being on the lookout for the possibility of price rebounding around the lesser value point mentioned earlier before a re-launch of buy order can be.
Regarding the downside movement of this market, bears would have to intensify their presence in the market by consolidating around the $1.00 value line. By so doing, a long-holding of positions around that point with a featuring of aggressive downward breaking will lead the market back into seeing through some support levels. However, short-position traders should be wary of abrupt rallying price motion that could also take a form along the line, especially if the southward depression violently surfaces.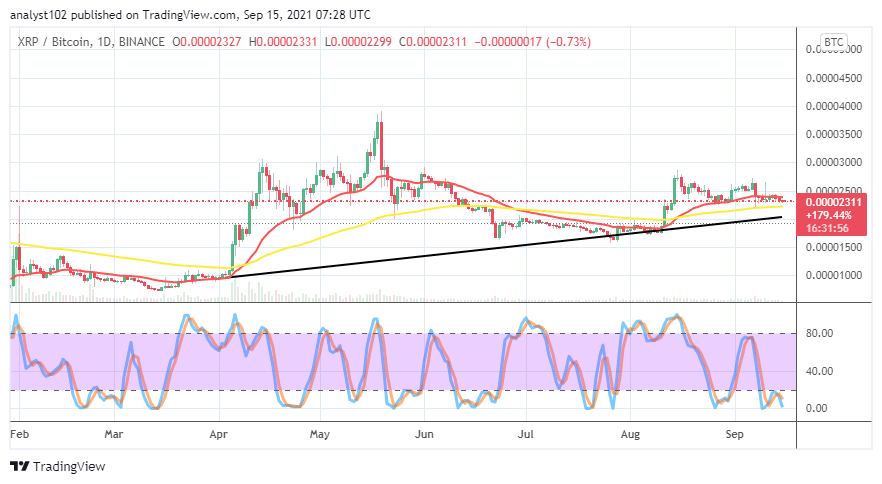
XRP/BTC Price Analysis
In comparison, despite a slight price retracement in the Ripple XRP/BTC market, the base crypto appears, possessing a higher chance of trending outlook as paired with the counter crypto. The cryptocurrency pair trade features closely beneath the trend line of the smaller SMA. The 50-day SMA indicator is underneath the 14-day SMA indicator. The Stochastic Oscillators are in the oversold region, seemingly attempting to cross the lines southbound closely at range zero line. That suggests that there can be a slight loss of grand to the flagship counter trading tool.
Looking to buy or trade XRP (XRP) now? Invest at eToro!

67% of retail investor accounts lose money when trading CFDs with this provider.
Read more:
Comments are closed.