Ethereum Price Prediction: ETH/USD Slides Below $3400
Ethereum Price Prediction – September 13
The Ethereum price prediction reveals that ETH is moving within a bearish pennant structure, subject to further downward pressure.
ETH/USD Market
Key Levels:
Resistance levels: $3900, $4100, $4300
Support levels: $2700, $2500, $2300
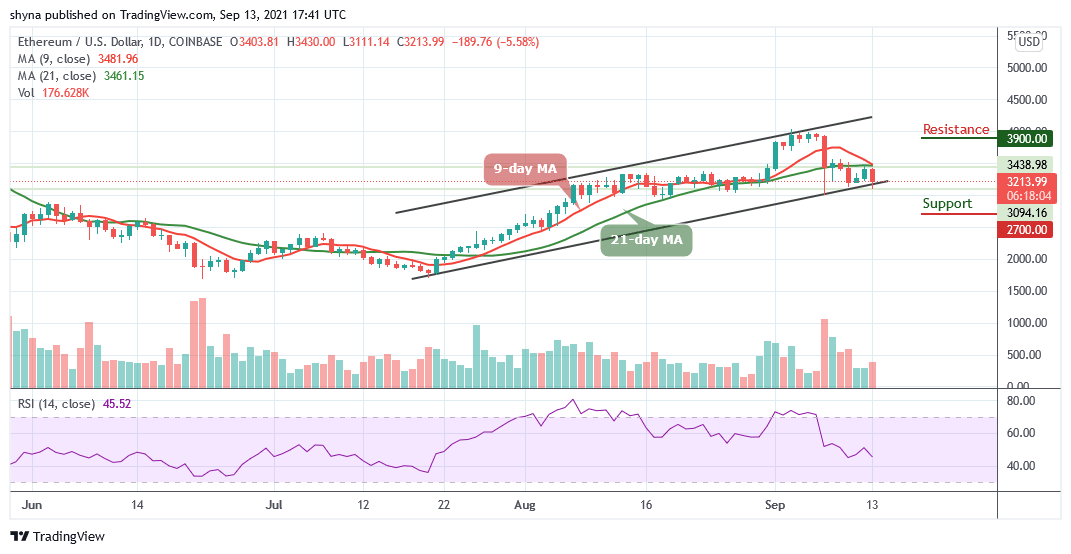 ETHUSD – Daily Chart
ETH/USD is back below the 9-day and 21-day moving averages following the bulls’ inadequacy to clear the resistance at $3500. The tentative support at $3200 did not match up to the selling pressure whereby the declines touched $3111 which happens to be the intraday low. Besides, the 9-day moving average is likely to drop below the 21-day moving average to confirm the downward movement.
Ethereum Price Prediction: Ethereum Price Confirms Bearish Movement
The technical signal reveals that the Relative Strength Index (14) suggests that the bears may continue to remain in control as the Ethereum price moves below the lower boundary of the channel. However, if the indicator dives below 40-level, ETH/USD could break down to the primary support at $2800. For now, a sideways movement could be a welcomed move below the current level of $3213.
However, this may allow the buyers to face the resistance levels of $3900, $4100, and $4300 in the coming sessions. Moreover, if the price drops below the lower boundary of the channel, the coin could locate the critical support at $2900 which is a close support level for the bears. Meanwhile, a bearish continuation could bring the market to $2700, $2500, and $2300 support levels.
When compares with BTC, the recent price decline continues to place the Ethereum pair in a downward trend after witnessing a bullish price action a few days, indicating an undecided market. The price action is still trading within the 9-day and 21-day moving averages. Looking at a long-term bear market, the 6700 SAT and below could provide further support levels for the next selling pressure.
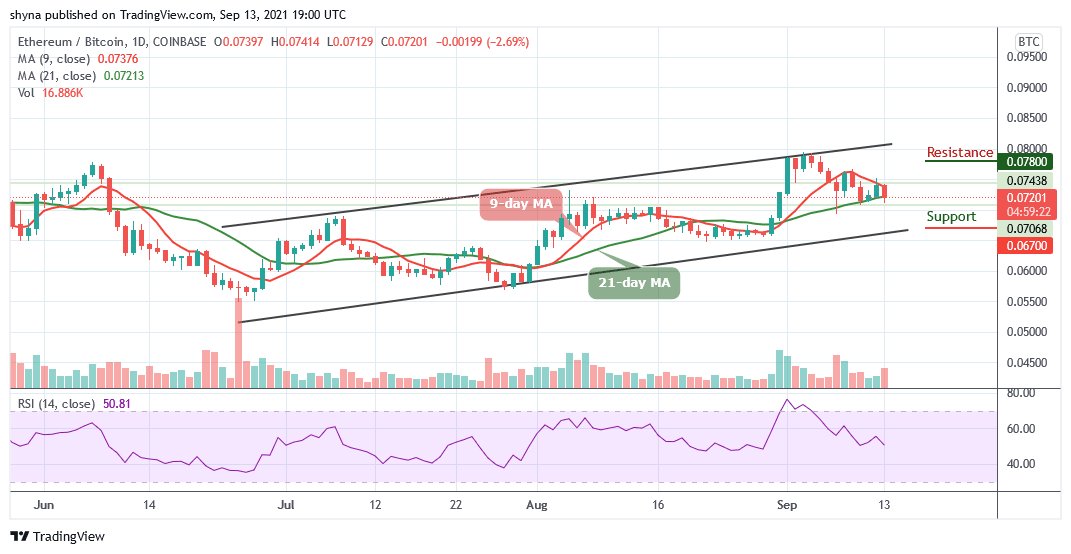 ETHBTC – Daily Chart
Moreover, traders can say that the sellers may likely return to the market after a little indecisive appearance. However, if the 7000 SAT can act as a solid line of defense against any further downtrend; buying pressure at the resistance level of 7800 SAT and above can be expected. The technical indicator Relative Strength Index (14) is likely to cross below 50-level which indicates downward movement.
Looking to buy or trade Ethereum (ETH) now? Invest at eToro!
67% of retail investor accounts lose money when trading CFDs with this provider
Read more:
Comments are closed.