Bitcoin Price Prediction: BTC/USD Signals Fresh Increase Above $51,000
Bitcoin Price Prediction – September 3
The Bitcoin price retests the $51,000 level as it is now rising, but it must cross above the channel for a steady increase.
BTC/USD Long-term Trend: Bullish (Daily Chart)
Key levels:
Resistance Levels: $55,000, $57,000, $59,000
Support Levels: $45,000, $43,000, $41,000
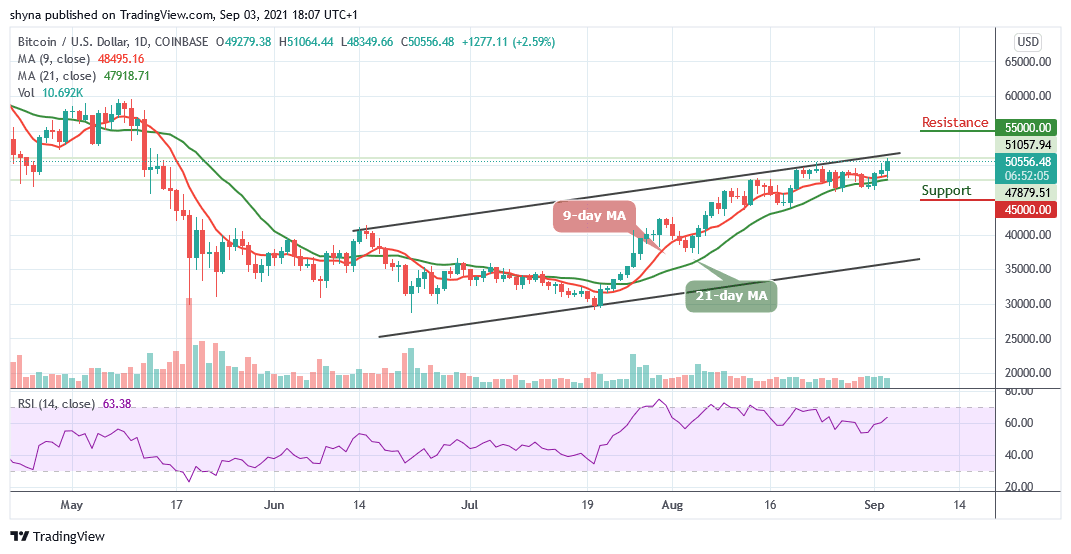 BTCUSD – Daily Chart
BTC/USD is currently recovering higher from the $48,349 support zone and the first digital asset must cross above the upper boundary of the channel to start another increase. As of the time of this writing, the Bitcoin price still sits above $50,000 as a near $50,600 peak was seen with this recent rally during the European session today but currently correcting downwards as the market prepares for another trading day.
Bitcoin Price Prediction: Would BTC Gain More?
According to the daily chart, traders could see that the Bitcoin price converges above the key level of $50,000. The 9-day MA trend-line is above the 21-day MA as they prepare to create more upsides. The Relative Strength Index (14) moves toward 65-level in an attempt to probably cross into the overbought region. However, the first major resistance is near the $51,000 level while the main resistance is still near the $50,800 level.
Moreover, a clear break above the $51,000 level could set the pace for a larger increase to $55,000, $57,000, and $59,000 resistance levels. Meanwhile, should the Bitcoin price fail to clear the $51,000 resistance, it could start a new decline as the initial support on the downside is near the $47,500 level. If there is a downside break below this level, the price could see a sharp decline towards the support levels of $45,000, $43,000, and $41,000 respectively.
BTC/USD Medium – Term Trend: Ranging (4H Chart)
According to the 4-hour chart, BTC/USD looks bullish as the market continues to show a sign of a bullish trend since the daily opening. However, the intraday trading is still looking bullish; following the recent rebound at $48,349 which is now a key support level. Meanwhile, any bearish movement below the 9-day moving average could locate critical support at $49,000 and below.
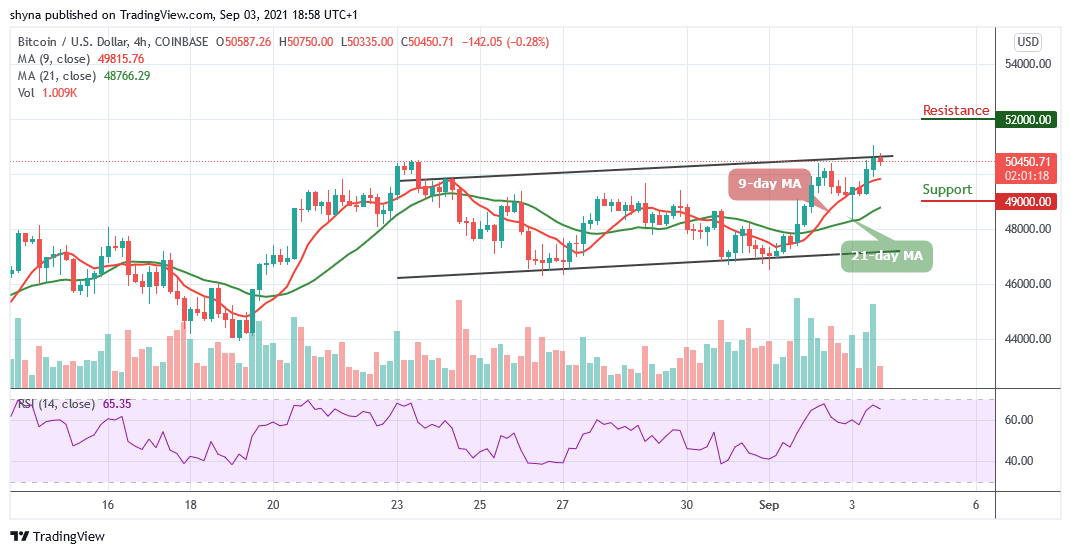 BTCUSD – 4 Hour Chart
However, considering the recent sharp rebound, the Bitcoin price may continue the bullish rally to $50,800 resistance. A climb above the upper boundary of the channel may further push the BTC price to the resistance level of $52,000 and above. As it appeared now, it seems the bears may likely return to the market as the Relative Strength Index (14) moves below 70-level, suggesting a bearish movement.
Looking to buy or trade Bitcoin (BTC) now? Invest at eToro!
75% of retail investor accounts lose money when trading CFDs with this provider
Comments are closed.