Bitcoin Cash Price Prediction: BCH/USD Trading Activity Suffers a Setback
BCH Trading Activity Suffers a Setback – September 8
Like many other crypto-economic operations suffering significant drawdown yesterday, the impact also felt on the BCH/USD price worth as the trading activity suffers a setback, having unable to move northward further from around $800. The market percentage rate of pushing is put at about 0.50, trading at the level of $676.
Trading Activity Suffers a Setback: BCH Market
Key Levels:
Resistance levels: $800, $900, $1,100
Support levels: $500, $400, $300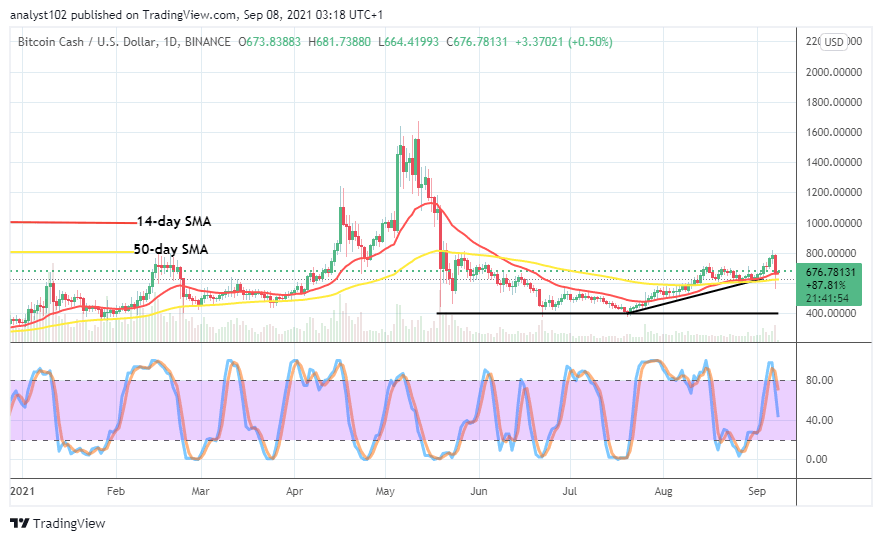
BCH/USD – Daily Chart
It is booked on the BCH/USD daily chart that the crypto trading activity suffers a setback in its valuation ever struggle achieved up to the high point of $800. The 50-day SMA trend-line is underneath the 14-day SMA trend-line in ranges of the value mentioned earlier and $600. A bearish candlestick occurred against the SMAs yesterday, briefly breaching the lower range value line to the south. The Stochastic Oscillators have the lines southbound closer to the range of 40.
BCH/USD trading activity suffers a setback; will there be further southward forces?
Quite much upward pressure has not been seen in the market valuation of the BCH/USD market operations. The crypto trading activity now suffers a setback as it continues for recoveries within definite range-bound zones. Deepening more into that, it appears that some subsequent ups and downs of the market will have to determine through either breaking the lower range line down further or breaking out at $800 line to resume northward trend motion.
On the downside, the BCH/USD market bears would have to build on upon any possible bearish candle that can surface below the starting point of yesterday’s bearish candlestick. As yesterday’s candlestick completed having a bottom shadow leaves a warning signal against getting smooth downward trading positions. Traders intending to go short on this crypto trad needed wary of exerting orders by applying proper money management principles.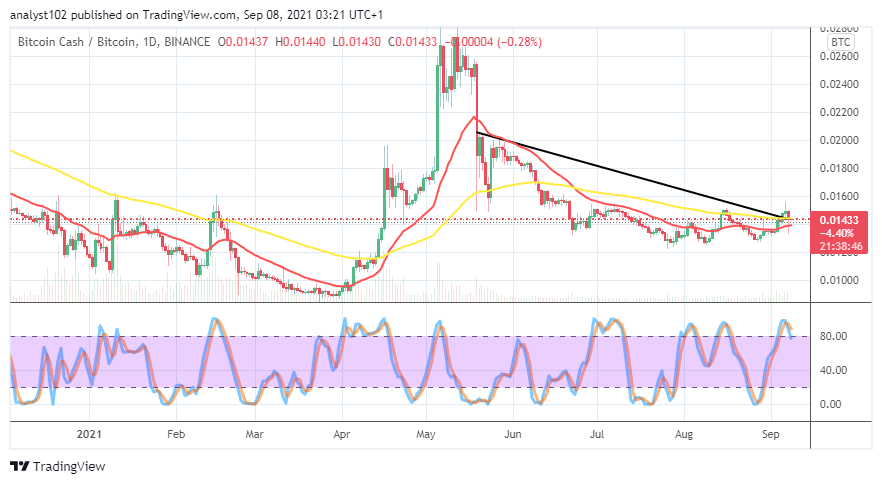
BCH/BTC Price Analysis
In comparison, Bitcoin Cash’s trending capability suffers a setback pairing with Bitcoin. The price analysis chart depicts that not much has been happening in terms of the market pushing for ups or downs over several weeks. The 14-day SMA indicator is underneath the 50-day SMA indicator at a close location. The Stochastic Oscillators have slightly crossed the lines southbound in the overbought region to touch the range at 80. It appears that low active price motion will still play out between the two cryptocurrencies until some more sessions.
Looking to buy or trade Bitcoin Cash (BCH) now? Invest at eToro!
67% of retail investor accounts lose money when trading CFDs with this provider.
Read more:

Comments are closed.