Bitcoin (BTC/USD) Market Attempts Valuation Downsizing
Bitcoin Price Prediction – August 9
A sign appears to establish that the BTC/USD market attempts valuation downsizing, having been unable to push past the resistance at $45,000. The crypto’s price trades around the line of $44,006 at a smaller negative percentage rate of 1.01.
BTC/USD Market
Key Levels:
Resistance levels: $45,000, $47,500, , $50,000
Support levels: $42,500, $40,000, $37,500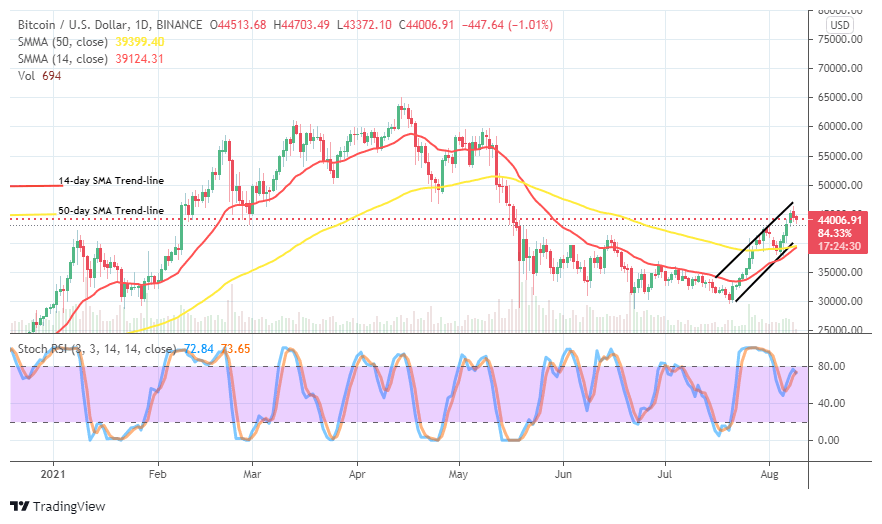
BTC/USD – Daily Chart
It now shows on the BTC/USD daily chart that the crypto market attempts valuation downsizing during yesterday’s trading operations while a smaller-lengthy bearish candlestick formed against the higher point at $45,000. The bullish channel trend lines drew to keep the tab of price movement in an uptrend motion. The SMAs are a bit far below the current trading level. The 50-day SMA indicator has been touched from beneath by the 14-day SMA indicator. And, the lower bullish channel line is alongside the SMAs’ area of positioning on the chart. The Stochastic Oscillators have closed the lines tightly near the range of 80, seemingly trying to cross southbound to indicate downward movement resumption.
Would there be a long line of declines as the BTC/USD market attempts valuation downsizing?
Price may not lose momentum significantly as the BTC/USD market attempts valuation downsizing currently. The present downward has between the supports of $42,500 and $40,000 to push. A sudden rebound around those points could allow bulls to find an entry. However, if that is not forthcoming, it means the buy order needed to be suspended further for a while.
On the downside, the BTC/USD bears have to solidify their presentence by adding more pressures on the crypto valuation below the resistance trading of $45,000. They still have a chance to see the price declining to a lower point around the immediate support at $42,500. Meanwhile, if the current downward move gets on an increase, variant supports will be breached for profiteering by bears. Launching further sell positions during that presumed trading time may easily lead to getting bears trap.
BTC/USD 4-hour Chart
The BTC/USD medium-term chart also exhibits that the crypto market attempts valuation downsizing in the bullish channel trend lines. The crypto’s price got resisted while trying to trade past a higher point around the level at $45,000. The 50-day SMA trend-line is closely located alongside the lower bullish channel trend-line as the 14-day SMA trend-line is above them. The Stochastic Oscillators have dipped the lines into the oversold region, seemingly trying to close the lines in it. That suggests that the downward pressure is getting a reduction on a gradual note. Traders needed to be very conservative about their entries.
Looking to buy or trade Bitcoin (BTC) now? Invest at eToro!
75% of retail investor accounts lose money when trading CFDs with this provide
Comments are closed.