Bitcoin (BTC/USD) Price Draws Backward Toward $50,000
Bitcoin Price Prediction – September 7
The financial record book kept, showing the market operations between Bitcoin and the US fiat currency has it that the crypto’s price draws backward toward the level of $50,000 while it couldn’t push to upside further beyond $55,000 resistance line. The market’s trading valuation is seen around $51,300 at a negative percentage rate of about 2.25.
BTC/USD Market
Key Levels:
Resistance levels: $55,000, $57,500, $60,000
Support levels: $50,000, $47,500, $45,000
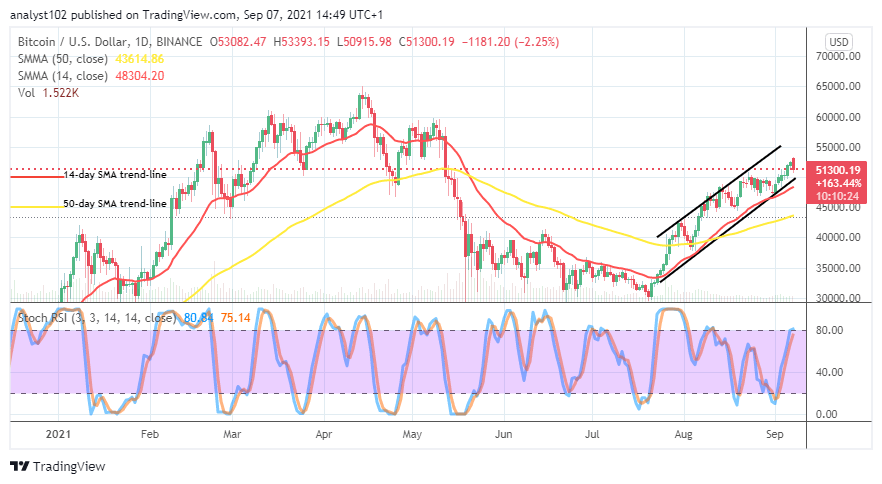
BTC/USD – Daily Chart
The daily chart depicts that the BTC/USD price draws backward between high trading zones of $55,000 and $50,000. The lower bullish channel trend-line drew a bit extensively past alongside the 14-day SMA indicator to touch the smaller value line mentioned earlier above the 50-day SMA indicator. The Stochastic Oscillators are seemingly attempting to close the lines at range 80. That could cause a stop of price motion for a while.
Could the current downward pressure get heightened as the BTC/USD price draws backward?
It could only be that the present downward pressure is necessary to occur to allow the BTC/USD market bulls find support to re-launch their positions. The heightening of the current downward pressure may not be weighty to breach past the $50,000 level sustainably. A price retracement movement, touching around the support line of that value line will potentially witness a quick re-bouncing motion.
On the downside, the present downward trading situation of the market needed to be capitalized upon by the BTC/USD market bears to hold against any attempts that the market may tend to swing up back. Breaking down of the $50,000 level will cause the decline, extending to a lower support line around $45,000. The positioning of the 50-day SMA indicator beneath the point suggests that there are far-reaching support lines that they may have to breach through if the downward pressure has come to stay again.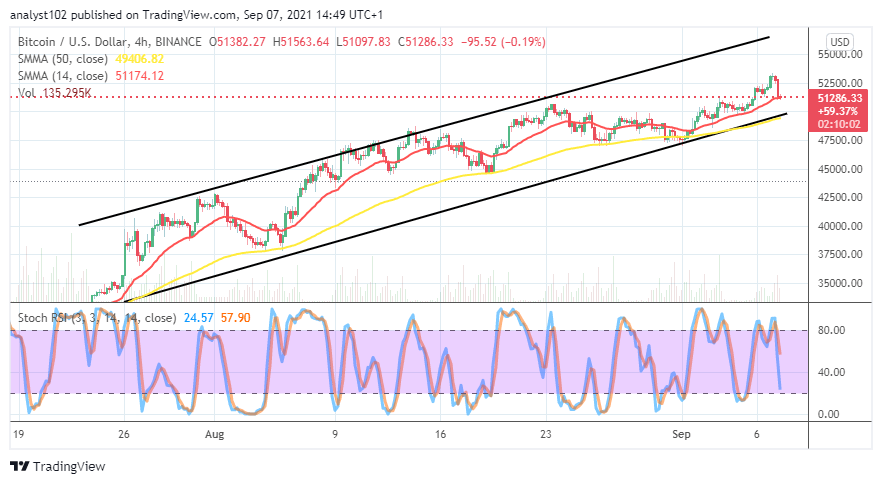
BTC/USD 4-hour Chart
There has been a bearish candlestick, signaling a start of downward pressure from a higher trading zone of the BTC/USD market. The crypto-economic price draws backward during today’s session. The bullish channel trend lines are still in place, playing a relevant part in other trading indicators. The 50-day SMA trend-line is around $50,000 in conjoining with the lower bullish trend-line underneath the 14-day SMA trend-line. The Stochastic Oscillators have swerved southbound, closely to the range of 20. That connotes the possibility of seeing an early rallying motion against the downward pressure.
Looking to buy or trade Bitcoin (BTC) now? Invest at eToro!

67% of retail investor accounts lose money when trading CFDs with this provider.
Read more:
Comments are closed.